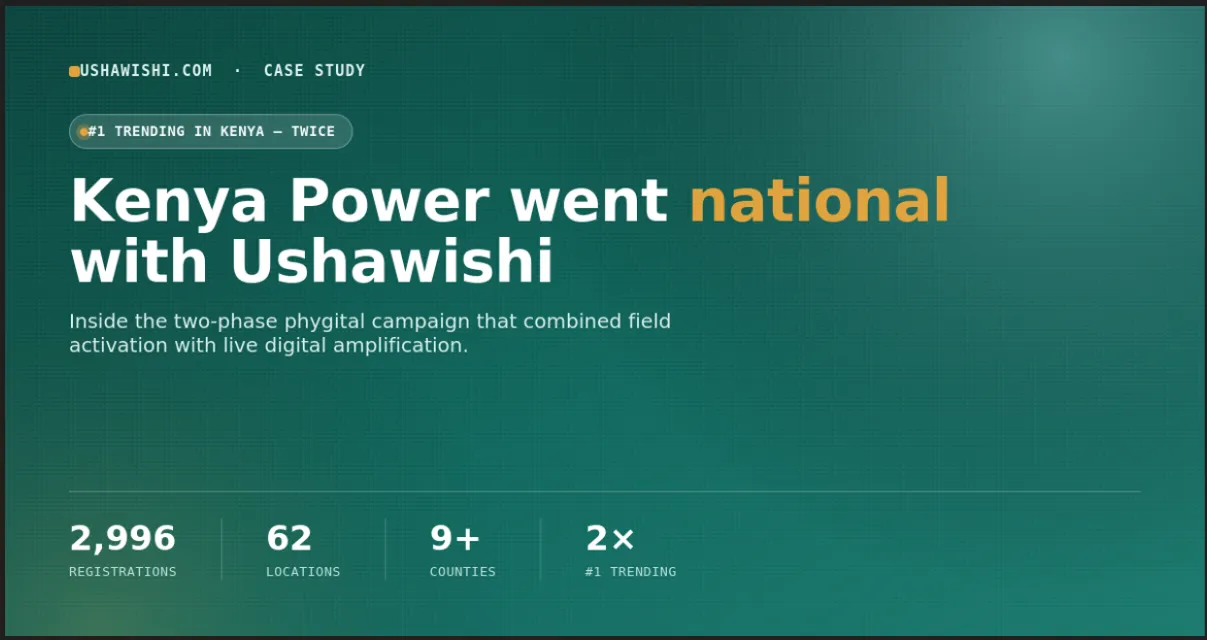
Twenty days of field activation. Sixty-two locations. Two campaign phases, run three weeks apart, covering everything from Nairobi's CBD to lakeside markets in Siaya to highland trading posts in the Southern Rift Valley — and on both phases, independently, #TwendeDigital hit #1 trending nationally in Kenya on X.
This is the full story of how that happened — not the highlight reel, but the actual mechanics: the partnership model, the channel strategy, the regional differences that changed our approach mid-campaign, the infrastructure problems we had to solve in real time, and the numbers behind every claim. It's told by the team that ran the digital half of it: ushawishi.com, in partnership with Av Lounge & Events Ltd, for The Kenya Power & Lighting Company Plc.
If you only read one section, make it the results table near the end. But if you're evaluating whether this kind of campaign could work for your own brand, the detail in between is where the real answer lives.
THE CHALLENGE
Replacing a banking hall with a hashtag
Kenya Power's strategic problem was straightforward to state and hard to solve. The company had made the call to progressively close all physical banking hall payment counters by June 2027, driven by a 70% reduction in in-person visits and digital channels already handling over five million customer interactions a month. The MyPower App and *977# USSD platform existed, worked, and were ready for scale. The infrastructure side of the digital transformation was essentially solved.
What wasn't solved was awareness, trust, and habit — at national scale, across radically different customer segments. A Nairobi office worker paying bills from a smartphone is a completely different adoption problem from a market trader in Siaya who may not have reliable data connectivity, or an elderly customer in a Rift Valley trading town who has paid at the same banking hall counter for twenty years and has never used a banking app of any kind. A single national TV advert or social media push treats these as one audience. They are not one audience, and treating them as one is exactly how digital transformation campaigns quietly fail even when the underlying technology is excellent.
The brief, in effect, was this: get millions of genuinely different customers, spread across the entire country, to trust and adopt a new digital habit before the safety net of the physical counter disappears — without a year-long budget or timeline to do it gently.
THE MODEL
How the work was split
Every single stop on the route, across both phases, followed the same repeatable three-layer structure. This consistency mattered enormously — it's what let the team measure results the same way on Day 1 as on Day 20, and compare Central Cluster's performance against Western Cluster's honestly, stop for stop.
The physical side got people in front of the truck — typically several hundred at a strong market-day stop. The digital side made sure the other 99.9% of Kenya's internet-using population saw it too. That's the layer ushawishi.com owned end to end: livestream production and hosting, the influencer network and content calendar, hashtag strategy, and the real-time analytics that told the field team, day by day, whether the messaging was landing or needed adjusting.
The content and hashtag architecture
Every stop carried a consistent hashtag family designed to do three different jobs at once. #TwendeDigital was the umbrella campaign tag, used on every single post regardless of platform or region — this is the tag that needed to accumulate enough volume, consistently, to have a shot at national trending. Location-specific tags (#KenyaPowerRoadShow, and cluster-specific variants) let local audiences find content relevant to their own town. And a functional tag layer — “Powered By Ushawishi,” referencing the MyPower App and *977# service directly — kept the actual call to action visible even in posts that were primarily entertainment or crowd footage rather than explicit advertising.
This mattered because a campaign that only ever posts direct advertising messaging rarely trends organically — people don't share ads. What trends is genuine event coverage: the dancers, the crowd energy, a Brand Ambassador helping an elderly market trader register her first app account, a mascot performer in the middle of a busy street. The hashtag architecture let all of that authentic content still carry the campaign's actual commercial message, consistently, without needing every single post to read like a product ad.
The campaign launched at Stima Plaza in Nairobi's CBD, with a flag-off attended by Kenya Power's senior leadership, and ran for ten days across Nairobi, Kiambu, Muranga, Embu, Meru, Laikipia, Kirinyaga, Nyeri, Nyandarua, and Nakuru counties — Central Kenya, the Mount Kenya region, and into the northern edge of the Rift Valley. This was, deliberately, the safest possible territory to prove the model in first: Kenya Power's most well-connected, most urbanised region, closest to head office support if anything went wrong operationally.
#1 #TWENDEDIGITAL — LAUNCH DAY #TwendeDigital trended #1 nationally on X on launch day itself — organically, with no paid promotion behind the hashtag itself. ushawishi.com's own influencer network of 101 creators generated 193,490 views and over 14,000 engagements across the ten days, with TikTok carrying nearly 95% of that volume — a strong early signal that short-form video, not static posts, was going to be the format that actually moved this campaign. Across the monitoring window, the #TwendeDigital hashtag reached a potential 38.7 million people on X, with positive sentiment running at roughly ten times the negative share.
What actually happened at Kagumo
The single highest-performing moment of Phase 1 — 11,200 concurrent Instagram Live viewers — happened at a market activation in Kagumo, Kirinyaga County. Nothing about Kagumo was unusual on paper: it was one stop among many, on a normal market day. What made the difference was the same thing that made every strong stop strong — a large, engaged physical crowd, streamed live, at a time of day when the local audience was actually free to watch. It became the internal proof point for the entire rest of the campaign: the physical crowd size and the digital viewer count were not two separate metrics to manage independently. They were the same signal, measured twice.
Having proven the model in Kenya Power's home territory, the second phase tested something genuinely harder: could the exact same playbook work in a part of the country the team had never activated before — with meaningfully different infrastructure, connectivity, language, and digital literacy? Western Cluster was also, by design, a bigger and more logistically demanding rollout than Central: more days, more regions, and a route that moved through genuinely unfamiliar territory in its second half.
The Western Cluster launched with an official flag-off in Molo, Nakuru County, then spent five days consolidating across the core Western Kenya market towns — Sabatia, Luanda, Mumias, Bumala, Sega, Bondo, Kimilili, Chwele, Bungoma, Mbale, Kakamega, Kitale, Mois Bridge, Soi, Awasi, and Chepsyon — before a single operational rest day and a five-day push into four entirely new regions: Siaya County, the Nyanza Cluster, the Gusii Highlands, and the Southern Rift Valley, closing in Sotik, Bomet County.
#1 #TWENDEDIGITAL — AGAIN #TwendeDigital trended #1 in Kenya again, independently of Phase 1 — with MyPower App itself trending simultaneously at #2, “Powered By Ushawishi” at #5, and “KPLC Western RoadShow” at #6. Four campaign-linked trends occupying the national top ten at the same time. That's not a fluke — it's what a consistent hashtag architecture, applied for the second time by a team that had already learned what worked, is supposed to produce.
Daily performance, in full
Unlike the aggregate headline number, the day-by-day breakdown below shows exactly where momentum built, where it dipped, and how the team responded after the operational break. The chart splits every day's registrations into MyPower App downloads versus *977# USSD enrollments — the two channels customers could choose between at every single stop.
Figure 1 — Western Cluster daily registrations by channel, Days 1–10, split by campaign phase
Registrations grew steadily through the core Western Cluster phase, peaking on Day 4 at 224 (56.0 average per Brand Ambassador) before a strong post-peak Day 5. What's notable is what happened after the 25 June rest day: rather than a slow restart, Day 6 landed almost exactly between the pre-break plateau and the post-break Nyanza peak — momentum held through the break rather than resetting. Day 7, in Nyanza, delivered the single highest registration count of the entire campaign (227), and the Gusii Highlands (Days 8–9) sustained above 200 registrations on two consecutive days despite being completely new territory for the team. The campaign closed on Day 10 in the Southern Rift Valley with a record 63 average registrations per Brand Ambassador — achieved with only three of the four Brand Ambassadors deployed that day.
Where the campaign actually reached: a regional breakdown
A single national total — 1,992 registrations — hides an important pattern. Broken down by the five regions the campaign passed through, the split shows exactly how much weight each part of the route carried, and it isn't even close to equal.
Figure 2 — Share of total Western Cluster registrations by region
The core Western Cluster alone — the first five days — accounts for essentially half of all registrations (49.1%), despite covering just over a quarter of the operational days. That's the established base doing what an established base should do. But within the expansion half of the campaign, the Gusii Highlands stand out clearly: 411 registrations, close to double Siaya's total and 81% ahead of Nyanza's — the single largest margin between any two expansion regions in the entire campaign. If Kenya Power were to prioritise one adjacent region for deeper follow-up investment based purely on this data, Gusii is the obvious answer, not the more commonly assumed lakeside or border markets.
The channel-strategy insight that made Phase 2 smarter than Phase 1
Regional adoption data revealed something the national average completely conceals: app adoption ranged from 74.9% in Siaya's lakeside communities to 88.5% in Nyanza's urban centres — a 13.6-percentage-point swing that tracked almost exactly with smartphone penetration and mobile data connectivity. USSD adoption moved in the precise opposite direction for the same underlying reason.
Figure 3 — MyPower App vs. *977# USSD adoption rate, by region
This is not a footnote — it's a targeting strategy. A national digital-adoption campaign should not run one identical script everywhere. It should default to app-first messaging in urban, well-connected markets like Nyanza's town centres, and USSD-first messaging in rural, lower-connectivity zones like Siaya's lakeside communities and much of the Southern Rift Valley — and it should know in advance, before the truck even arrives, which stops fall into which category. That's an insight only available to a campaign running at genuine geographic scale and actually measuring results region by region, rather than reporting one blended national number and calling it done.
Instagram Live: where and when the audience actually showed up
The viewer curve across the nine days with recorded Instagram Live data is not a smooth build toward a single climax — it's genuinely bimodal, with two distinct peaks either side of the operational break.
Figure 4 — Western Cluster Instagram Live peak concurrent viewers, Days 1–9
Day 4 (16,600 viewers, driven by Luanda Market in full daylight) and Day 6 (14,905 viewers, driven by the Bondo activation, which field records confirm ran into dusk under the truck's own lighting rig) are the two standout days. That the second-highest peak of the entire campaign came from an evening-lit stream, not a daytime market-day stream, is worth testing deliberately rather than dismissing as incidental — it suggests dusk timing is at minimum competitive with the strongest daytime slots for this audience, and possibly genuinely complementary, giving working customers who can't watch during the day a second real opportunity to tune in.
Pika na Power: turning a registration into a reason to stay
Western Cluster carried forward and meaningfully expanded a mechanic first proven in Phase 1: Pika na Power, an electricity-token incentive tied directly to successful registration. Every customer who registered on the MyPower App or enrolled via USSD received complimentary electricity tokens on the spot — removing the single biggest psychological barrier to trying a new financial-adjacent app for the first time, while simultaneously giving Brand Ambassadors a live, immediate demonstration that the app actually works and delivers real value.
In the Western Cluster specifically, this was extended with a dedicated E-cooking demonstration unit — a second vehicle, separate from the main roadshow truck — where branded staff demonstrated electric pressure cookers and air fryers directly to crowds at stops like Sabatia. It turned an abstract “go digital” instruction into something a sceptical customer could see and touch, directly connecting the campaign's safety-education objective around electric cooking to the same registration moment driving app adoption.
CHALLENGES & SOLUTIONS
The infrastructure barriers nobody puts in a highlight reel
A campaign case study that only reports wins isn't a useful one to learn from. Across both phases, the same handful of infrastructure and technical barriers appeared again and again — consistently enough that they represent system-level constraints on national digital adoption in Kenya generally, not execution failures specific to this campaign.
None of these were solved by better advertising — they were solved operationally. USSD was deployed and actively promoted as the primary alternate pathway precisely because it sidesteps app storage and camera-hardware limitations entirely, which is exactly why it reached 25.1% adoption in Siaya's most infrastructure-constrained communities. Brand Ambassadors shifted registration pushes toward early morning hours where possible, when telecom SMS delivery performed measurably better. And backup SMS-based registration links were kept ready at every stop as a fallback for customers whose QR scanner simply wouldn't cooperate. The lesson generalises well beyond this one campaign: any national digital adoption push in a market like Kenya's needs a device-agnostic fallback channel built in from day one, not bolted on after the first week reveals the problem.
BRAND AMBASSADORS
The team behind the numbers
Every registration in this report was a Brand Ambassador standing in front of an actual customer, explaining an app, and walking them through it — often multiple times a minute, for ten hours a day, for ten days straight. The Western Cluster's core field team was four people: Justine, Avine, Tracy, and Edinah, supported by event crew, drivers, dancers, and production staff from Av Lounge & Events Ltd, with a field supervisor compiling daily reports and escalating technical issues back to Kenya Power in real time.
The campaign's single highest individual performance — 67 registrations in one day — was set by Justine on Day 10 in Sotik, the closing stop of the entire route. That day's team-wide average of 63 registrations per Brand Ambassador is itself a campaign record, and it was achieved with only three of the four Brand Ambassadors on the ground, after Avine became unavailable. Read together, those two facts say something specific: the remaining team didn't just cover the gap, they individually worked roughly 24% harder than the campaign's baseline pace to do it, on the final and most physically demanding day of a ten-day route. That's the kind of operational resilience that doesn't show up in a headline number but is exactly what makes a headline number achievable in the first place.
THE FULL PICTURE
Two phases, one system
Across the full campaign window, Kenya Power's MyPower App user base grew from 1.2 million to 2.4 million users — a 100% increase directly attributable to the combined field and digital push across both phases.
Reading the target-vs-actual picture honestly
Every Western Cluster target was not just met but exceeded — and by meaningfully different margins, which is itself informative rather than just a set of green checkmarks.
Figure 5 — Western Cluster core KPIs as a percentage of pre-campaign target
Digital Reach outperformed its target by the widest margin (187.4%), consistent with a target that was set conservatively against Instagram Live's genuine viral potential once a strong stream, like Luanda or Bondo, takes off on its own momentum. Field Registrations (132.8%) and App Adoption (111.3%) cluster closer to their targets, suggesting those targets were calibrated more realistically against known field-team capacity from the start. USSD Adoption's narrower 110% margin is arguably the most operationally meaningful result on this chart: it confirms the *977# channel is reliably clearing its bar as a rural fallback, rather than over- or under-performing — which is exactly what a well-tuned secondary channel is supposed to do, no more and no less.
FAQ
Frequently asked questions
What is a phygital marketing campaign?
A phygital campaign combines physical, in-person activation — a roadshow, a demonstration team, a live event — with simultaneous digital amplification, typically live streaming and social media, so the digital audience reached is many times larger than the people physically present. The two channels are planned and measured together, not run separately.
How does ushawishi.com measure the success of an influencer marketing campaign?
Primarily through a combination of field conversion data (registrations, sign-ups, or sales directly attributable to the activation), digital reach and engagement metrics (livestream viewers, hashtag reach, sentiment), and national trending performance where relevant. For this campaign specifically, that meant tracking field registrations by channel and region, Instagram Live viewership per event, and X (Twitter) trending position and sentiment, every single day of both phases.
Can a roadshow or brand activation campaign work outside Nairobi?
Yes — and the Western Cluster phase of this campaign was built specifically to test that question. It not only worked outside Nairobi, it produced a larger total registration count and a larger peak digital audience than the Nairobi-based Central Cluster phase, while activating in territory the team had never worked in before.
How long does a national-scale digital adoption campaign take to plan and run?
This engagement ran as two ten-day field phases, three weeks apart, with the gap used for review and preparation rather than downtime. Planning and creative development for a campaign of this scale typically needs several weeks ahead of the first field day, particularly for hashtag architecture, influencer network activation, and route logistics.
Why use both a mobile app and a USSD channel in the same campaign?
Because a single national customer base is never one audience. This campaign's own data showed app adoption swinging from 74.9% to 88.5% depending on region, with USSD adoption moving in the opposite direction for the same underlying connectivity reasons. Offering both channels, and adjusting which one is promoted more heavily by region, meaningfully increases total conversion versus offering only one.
ushawishi.com · Kenya's Influencer Marketing Platform · In partnership with Av Lounge & Events Ltd